zenpundit.com » Blog Archive » Graph-types 2: towards a universal graphical mapping language

Graph-types 2: towards a universal graphical mapping language

[ by Charles Cameron — for background, see Graph-types 1: sample graphs and boards ]
.

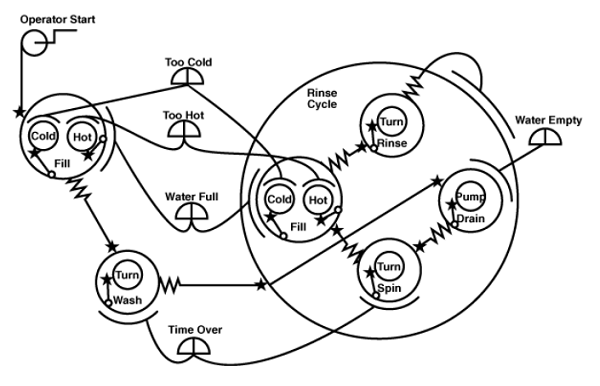
The world is full of all sorts of wondrous things, and we can map and model many if not all of them. Here are some examples of the kinds of maps I’d like to see integrated in the One Big One. For a fun first instance, here’s a dynamic model of the functioning of a washing machine:

Washing machine 600

If you’re figuring out how to map the world, of course, you may think first of economic stocks and flows in a Forrester-style model, like this diagram for a model of housing market cycles:

:Housing development stocks and flows 600

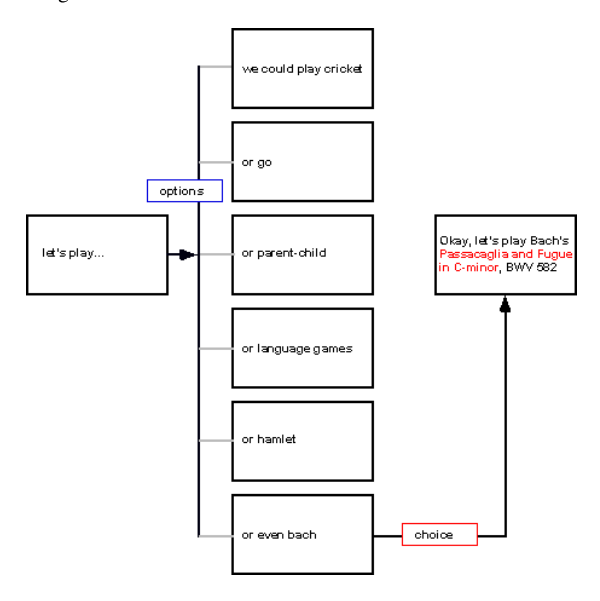
There are a whole lot of different modeling conventions of this sort. One of my own devsing has to do with choice — and in this instance, with the meanings that can be given to the words “let’s play”:

ChoiceBach diagram

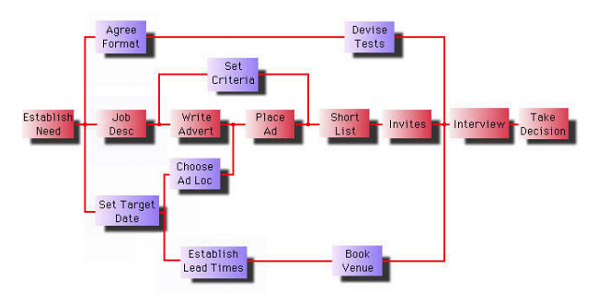
There are PERT Charts, which allow one to plan the sequencing of various “streams” of actions to arrive optimally at a given end-point:

PERT 600

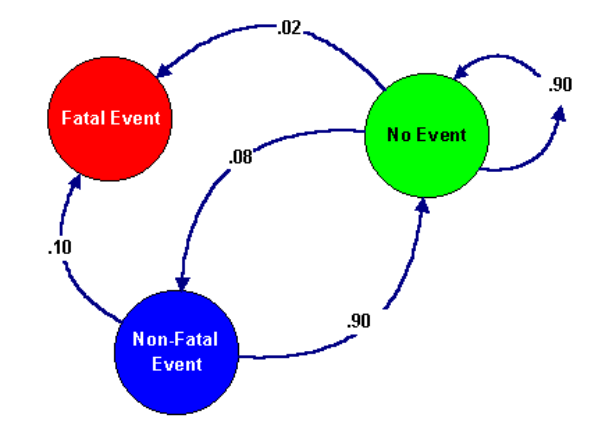
There are Markov chains for probabilistic inference:

Marjov chain

And then there are those subatomic Feynman diagrams I mentioned in a recent post. I believe this one is the first published Feynman diagram, and you can find it on an Edward Tufte page that’s worth taking a look at in its own right:

Feynman_AmericanScientist

For those of you who may be interested, I’m attaching here an earlier attempt to corral such things which I originally wrote as part of a 159-page documentation of my HipBone games for Amos Davidowitz of the Institute of World Affairs in DC:

Variety of Concept Mapping diagrams

**

The world-system in actuality “answers” in some way to each of the types of model I’ve illustrated above — and then some! — which leads me to believe that some sort of grand map or model should in principle be devisable which would incorporate them all — in principle, though not perhaps, or not yet, in practice.

That’s my idea — I hope it will stimulate msome quirky thoughts, questions, insights..

See, “node and edge” graphs are everywhere, and I’ve discussed several more of them in a series of posts titled On the felicities of graph-based game-board design which you may want to look at: 1, 2, 3, 4, 5.

And hey — the human brain, too, is a node and edge affair, so it may not be too surprising that my casual reading roundup this morning pointed me to this image of a real-world object called a Stentrode:

Stentrode 600

That’s from a DARPA page titled Minimally Invasive “Stentrode” Shows Potential as Neural Interface for Brain, and it’s a device designed by a team in Melbourne that can be slipped into the brain via the blood-stream, providing “a brain-machine interface that taps into your motor cortex through a relatively simple operation” allowing a patient to “directly steer an exoskeleton or artificial limb through thoughts alone”.

Like the brain that devised it, it is a physical edge and node graph — and so-o-o brautiful.

I am in awe.

One Response to “Graph-types 2: towards a universal graphical mapping language”

  1. Daniel F. Bassill Says:

    Here’s another resource. The cMap people created this “cmaps around the world” site about a year ago. http://cmap.ihmc.us/cmaps-around-the-world/


Switch to our mobile site