zenpundit.com » graphical thinking

Archive for the ‘graphical thinking’ Category

Reversals and blowbacks

Wednesday, March 9th, 2016

[ by Charles Cameron — cf. boustrophedon, enantiodromia, ouroboros, paradox, unintended consequences ]
.

I have had this graphic around for a while:

reverse arrow

As you can see, I originally intended it to accompany a quote from Oliver Wendell Holmes:

We should be eternally vigilant against attempts to check the expression of opinions that we loathe.

— but it can actually serve a more general purpose than that — the basic “opposing arrows” graphic can be used to cover all sorts of situations in which a push in one direction results in movement in another. In the OW Holmes example, the two opposed pushes occur within the same person — we are bidden to protect that which we despise.

Here, though, is an instance in which what seems a laudable action on the part of the authorities has a counter-productive result:

No longer a movement that concentrates its brutality on the Nigerian government, [Boko Haram] now attacks mainly civilians, using women and child suicide bombers as its primary weapons of war. The reasons why the group has changed tactics, however, and the complex motives for why women and children have become the weapons of choice, needs to move beyond the fallback narrative of victimhood if attempts to end the unthinkable are to succeed [my emphasis].

That’s essentially the “we learn, they learn” dynamic that’s present in all insurgency-counterinsurgency situations, no? It’s the basis of escalation — it’s what Hermann Kahn‘s Ladder was all about — it’s a bidding war.

But I want to capture it in its most basic moment, when something pulls its opposite into place. The Taoists expressed the same idea very gracefully —

tai chi

— but maybe that’s just a little too graceful — I’m looking for something just a bit more abrupt, with a more overt sense of tension.

So you may be seeing more of my reverse arropw / blowback diagram:

reverse arrow oops

Oops!! It’s often, though by no means always, a sign of folly.

Graph-types 2: towards a universal graphical mapping language

Tuesday, February 9th, 2016

[ by Charles Cameron — for background, see Graph-types 1: sample graphs and boards ]
.

The world is full of all sorts of wondrous things, and we can map and model many if not all of them. Here are some examples of the kinds of maps I’d like to see integrated in the One Big One. For a fun first instance, here’s a dynamic model of the functioning of a washing machine:

Washing machine 600

If you’re figuring out how to map the world, of course, you may think first of economic stocks and flows in a Forrester-style model, like this diagram for a model of housing market cycles:

:Housing development stocks and flows 600

There are a whole lot of different modeling conventions of this sort. One of my own devsing has to do with choice — and in this instance, with the meanings that can be given to the words “let’s play”:

ChoiceBach diagram

There are PERT Charts, which allow one to plan the sequencing of various “streams” of actions to arrive optimally at a given end-point:

PERT 600

There are Markov chains for probabilistic inference:

Marjov chain

And then there are those subatomic Feynman diagrams I mentioned in a recent post. I believe this one is the first published Feynman diagram, and you can find it on an Edward Tufte page that’s worth taking a look at in its own right:

Feynman_AmericanScientist

For those of you who may be interested, I’m attaching here an earlier attempt to corral such things which I originally wrote as part of a 159-page documentation of my HipBone games for Amos Davidowitz of the Institute of World Affairs in DC:

Variety of Concept Mapping diagrams

**

The world-system in actuality “answers” in some way to each of the types of model I’ve illustrated above — and then some! — which leads me to believe that some sort of grand map or model should in principle be devisable which would incorporate them all — in principle, though not perhaps, or not yet, in practice.

That’s my idea — I hope it will stimulate msome quirky thoughts, questions, insights..

See, “node and edge” graphs are everywhere, and I’ve discussed several more of them in a series of posts titled On the felicities of graph-based game-board design which you may want to look at: 1, 2, 3, 4, 5.

And hey — the human brain, too, is a node and edge affair, so it may not be too surprising that my casual reading roundup this morning pointed me to this image of a real-world object called a Stentrode:

Stentrode 600

That’s from a DARPA page titled Minimally Invasive “Stentrode” Shows Potential as Neural Interface for Brain, and it’s a device designed by a team in Melbourne that can be slipped into the brain via the blood-stream, providing “a brain-machine interface that taps into your motor cortex through a relatively simple operation” allowing a patient to “directly steer an exoskeleton or artificial limb through thoughts alone”.

Like the brain that devised it, it is a physical edge and node graph — and so-o-o brautiful.

I am in awe.

Graph-types 1: sample graphs and boards

Tuesday, February 9th, 2016

[ by Charles Cameron — background reading for the post which follows ]
.

This is a quick look at node and edge graphs and some of the boards used in HipBone, DoubleQuote, and Sembl Games — a refresher for those who already know, and a quick intro for those who may not…

graphs

Above, you’ll see two graphs — one very simple and one far more complex. What they have in common is points (known as nodes) and lines connecting them (known as edges). Graphs of this kind are instances of the basic pattern on which much of contemporary understanding of the world rests, as it mostly rested on linear thinking in previous centuries. They are everywhere.

**

In the next image, however, we see some medieval and renaissance instances of graphs in which concepts and their relations have been assigned to the nodes and their edges — these are also commonly found today, but the early versions here have a beauty all their own..

3-ancient-bds2

Left to right: the Sephirotic Tree of classical Jewish Kabbalah; Oronce Fine‘s diagram of the four elements; and a medieval respresentation of the Christian Trinity. It was the Reformation & Counter-Reformation that really put a stop to this kind of graphical thinking, as Ioan Couliano teaches us.

**

Finally, my HipBone Games and the Museum Game that Cath Styles designed for the National Museum of Australia use graphs as their boards, and the players assign concepts to the various nodes, establishing conceptual links between them:

Game boards

Upper left, th4 standard WaterBird board for HipBone play; upper right, one of Cath’s boards for the Museum Game; lower left, the DoubleQuotes board, and lower right, a beautiful graph on which I hoped gto play a symphonic Bead Game.

**

That’s the essential background you need to proceed to the next post, Graph-types 2: towards a universal graphical mapping language, where I lay out my hopeful, hopeless scheme for a Grand Unified Map. Onwards.

Comparative martyr photos for Ibn Siqilli

Tuesday, February 9th, 2016

[ by Charles Cameron — Muslim and Sikh memorial photos have similar aesthetic & emotional appeal ]
.

I’ve long been interested in the death photos used in AQ and IS propaganda, several of which Chris Anzalone [aka Ibn Siqilli] has documented, eg:


Al-Zubayr al-Sudani, as featured in the AQC-produced video series “Wind of Paradise

and:

baitullah-mehsud
The late Tehrik-i Taliban Pakistan leader, Baytullah Mehsud.

**

Today, I ran across similar images from a site devoted to the Khalistan (Sikh homeland) liberation movement

Sikh martyrs

As far as I can tell, being linguistically and historically challenged, the gentleman on the right would be Gurjant Singh Budhsinghwala — perhaps someone can help me identify the gentleman on the left.

Sceenius: Y2K and a universal graphical mapping language

Tuesday, February 9th, 2016

[ by Charles Cameron — a mental long-jump, following Sceenius: the macro in micro, Nepal ]
.

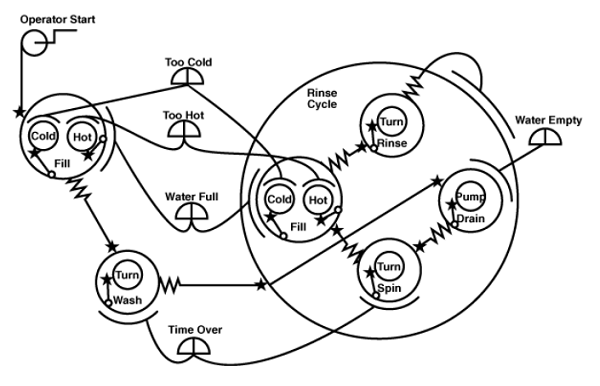
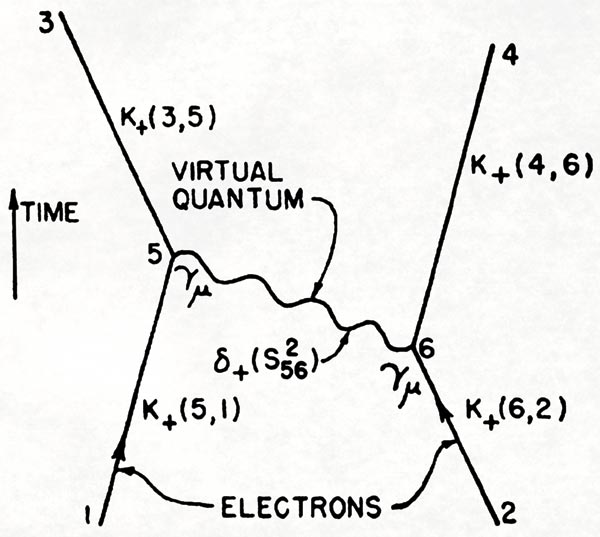
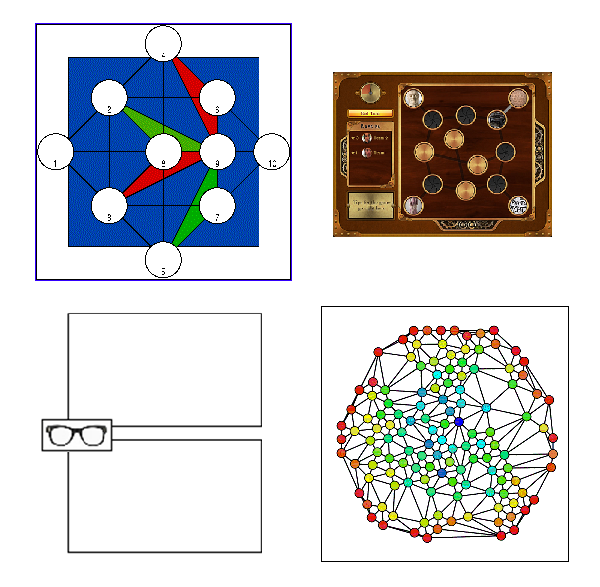
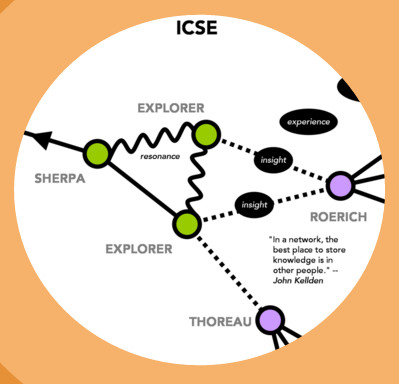
It’s a stretch, I know, and whether it will prove a useful leap or not I have no idea — but for the record, this detail from slide 8 of the Sceenius promo caught my eye, offering a graphical continuity between my own HipBone / Semble gameboards and Richard Feynman‘s celebrated particle diagrams:

Sceenius

**

I have this almost Borgesian interest in what kind of map of the world we’d get if we had a universal language of graphs.

When I was working on the potential social implications of the Y2K computer bug — which included the al-Qaida “Millennium Plot” and Albert Ressam‘s attempt to blow up the international terminal at LAX during the millennial roll-over — my friend and colleague Don Beck of the National Values Center / The Spiral Dynamics Group suggested in a private communication:

Y2K is like a lightening bolt: when it strikes and lights up the sky, we will see the contours of our social systems.

As it turned out, the lightning struck and failed to strike, a team from the Mitre Corporation produced a voluminous report on what the material and social connectivity of the world boded in case of significant Y2K computer failures, we did indeed get our first major glimpse of the world weave, and thankfully, very little of that weave was broken as the new millennium dawned.

But as Thomas Barnett put it in his first book, The Pentagon’s New Map:

Whether Y2K turned out to be nothing or a complete disaster was less important, research-wise, than the thinking we pursued as we tried to imagine -– in advance -– what a terrible shock to the system would do to the United States and the world in this day and age.

Viewing the world as an integral, interconnected whole, illuminated by our various preparations for whatever eventualities might arise, stuck with me. And my take-away was the idea of a world-map that represented as widely and richly as possible the tugs and tensions, the causalities and probabilities, the chains of command and channels of distribution that are present in our world — a pragmatist’s equivalent, if you like, to the Buddhist Net of Indra.

**

Our mandate [at The Arlington Institute] was to understand potential social fall-out of the Y2K computer event and related millennial events. Essentially, this was a dry run for failures in the intricately cross-connected world we now inhabit, and even thought Y2K was a “non-event” in terms of computer disruptions, it was an education for those of us who tracked it.

In that spirit, a few years ago, I wrote:

The world is woven of many different processes: causality and synchrony perhaps each play a role in determining the moment, qualitative and quantitaive, head and heart concerns all have their role, fear and hope impact stock prices, movement (e-motion) in the inner world triggering movement (motion) in the the outer, rumors of wars becoming blacks ops in the wars they mimic, with the Cartesian mind / matter barrier no less than the barriers between our disciplines falling… and in all this shuttling to and fro of the looms of the Moirae, humans find themselves making models and diagrams to understand and explain…

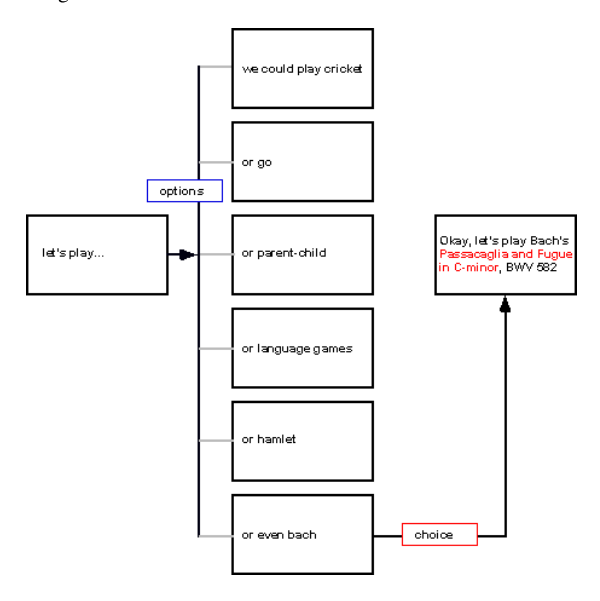
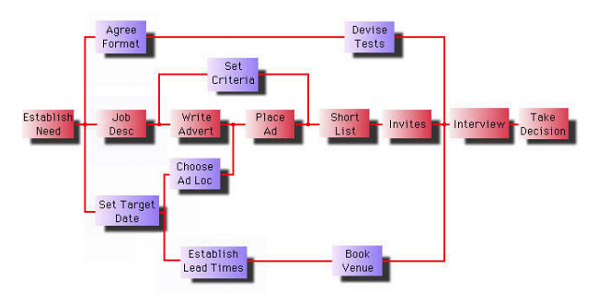
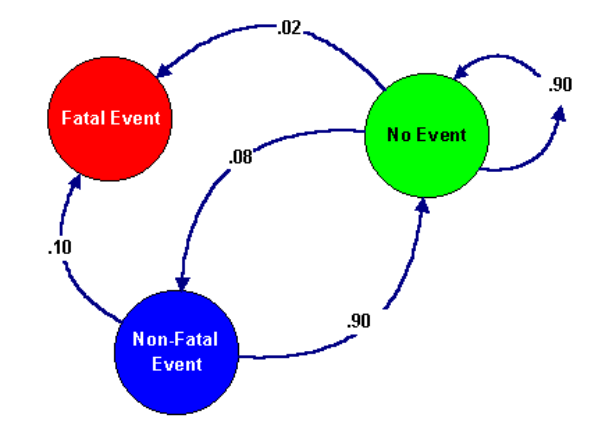
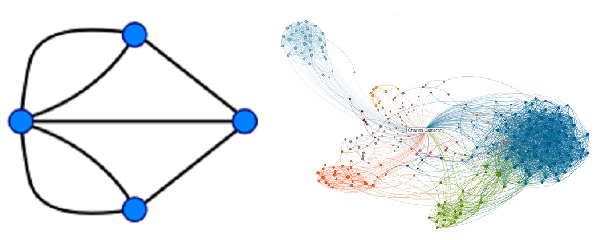
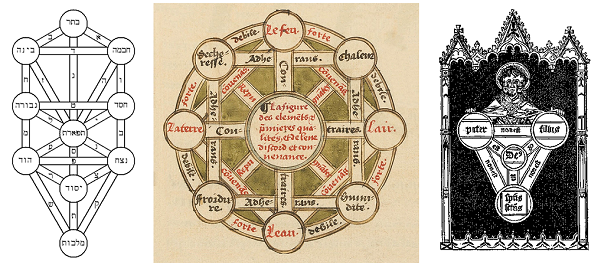
My point is that that our systems diagrams, flow charts, maps, conceptual networks, semantic graphs, HipBone Games and so forth are not isolated entities but family members, and that at some point we may wish or need to be able to link one of the diagram types above with others into a master-diagram, for which we currently lack a graphical language. [ … ]

I think we should at the very least be thinking about how these various diagrams intersect, overlap and breed offspring after their own kind..

**

This project — an actual world-map of this kind — is hopelessly utopian, impossible, needed, encyclopedic like Wikipedia, a secular bead game in its own right, and in general probably best left as a Hilbert-like challenge for future generations to gnaw at..

Next post: a few examples of examples of graph-types that should be included.


Switch to our mobile site